
Technical Analysis of the Financial Markets by John J. Murphy: Summary and Key Topics
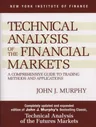
Technical Analysis of the Financial Markets is John J. Murphy's broad guide to chart analysis. This page summarizes what the book covers, how Murphy has said the tools fit together, and who the book suits, and it explains the main concepts in plain English. It's a guide to the book's topics, not a chapter-by-chapter recap.
Educational content only. This page describes a book; it is not investment advice, and no book described here predicts or guarantees trading results. Trading carries risk of loss. TradingLoot doesn't claim to have read this book; this guide is built from the sources described below and listed under Book details.
Where this guide comes from
- The book's coverage comes from its publisher, Penguin Random House, and from a partial contents listing in its Google Books record. We use those only to say which topics the book covers, not what it says about them.
- Murphy's public views come from outside the book: his essay "Ten Laws of Technical Trading" on StockCharts' ChartSchool, and a 2003 interview published by Stocks & Commodities. Where this page cites them, it says so.
- The plain-English explanations of each concept are TradingLoot's own, written for this page. They describe how these tools are generally understood, not how Murphy explains them.
Technical Analysis of the Financial Markets in one minute
- What it is: according to its publisher, Murphy's update of his earlier Technical Analysis of the Futures Markets, extended to all the financial markets. The current Prentice Hall Press edition is dated 1999.
- What it covers: nearly the whole classic toolkit: charts, trend, price patterns, volume and open interest, moving averages and oscillators, point and figure, candlesticks, Elliott Wave, cycles, intermarket analysis, stock market indicators, trading systems and money management.
- How the publisher frames it: as "a thorough and accessible overview of the field of technical analysis," with a special emphasis on futures markets.
- What it isn't: a single trading method. It surveys many tools rather than prescribing one system.
- The short version, in TradingLoot's words: a reference for learning the vocabulary and tools of chart analysis, best read trend first, then the tools built on it.
What kind of book this is
The publisher presents it as a second edition: Murphy's earlier futures book, revised to cover all the financial markets. It says this edition adds material on candlestick charting, intermarket relationships, and stocks and stock rotation, along with developments in computer technology, technical tools and indicators. It still puts a special emphasis on futures.
The Google Books listing points the same way. Its earliest headings deal with the philosophy and rationale of technical analysis, and the rest range from chart construction through to systems, money management and specialist methods such as Market Profile.
TradingLoot's reading: treat it as a survey and a reference. Its value is breadth: one place to meet almost every classic technical tool before deciding which ones to specialize in. The edition is dated 1999, so expect its market examples and its software material to predate today's platforms, even though the core chart concepts are still in wide use.
Murphy's starting point
This section draws on Murphy's essay "Ten Laws of Technical Trading," which StockCharts describes as advice he often gives to people new to technical analysis. It's outside the book, so it shows how Murphy approaches charts, not how the book itself is written.
His first piece of advice is about perspective. Start with monthly and weekly charts covering several years, then move to daily and intraday charts, because a short-term view on its own can mislead. Next, decide which size of trend you're trading, short, intermediate or long term, and trade in its direction: buy dips in an uptrend, sell rallies in a downtrend. As he puts it, "let the longer range chart determine the trend, and then use the shorter term chart for timing."
StockCharts' own introduction to the essay sums up his approach as caring more about where a market is heading than about the reasons behind the move. That's StockCharts' summary rather than Murphy's wording, but it captures why trend comes first in everything that follows.
What the book covers
The book's topics are grouped here into six themes of TradingLoot's own, not in the book's order. Each theme says what the publisher or the Google Books listing shows the book covers, then explains the ideas in plain English. The explanations are ours; they aren't a summary of Murphy's chapters, and they leave out his specific rules.
Charts and trend
In the book: headings on chart construction, the basic concepts of trend, trendlines, channel lines, speed resistance lines and price gaps. Support and resistance, retracements and Dow Theory appear in the record's index of common terms.
In plain English: a chart records price over time; bar, line and candlestick charts show the same data in different ways. An uptrend is a series of higher highs and higher lows, a downtrend the reverse, and a market doing neither is in a range. Support is a price area where declines have tended to stop; resistance is where rallies have tended to stall. A trendline connects rising lows or falling highs, and a channel adds a parallel line on the other side. A gap is a price range where no trading took place between one bar and the next. Dow Theory, drawn from Charles Dow's writings, is an early framework that much of trend analysis grew out of.
Price patterns
In the book: headings on price patterns and the importance of volume, complex head-and-shoulders patterns and variations from the ideal pattern, then continuation patterns including the ascending triangle, the wedge and the continuation head and shoulders.
In plain English: reversal patterns, such as head and shoulders or double tops and bottoms, suggest a trend may be ending. Continuation patterns, such as triangles, flags and wedges, are pauses within a trend that often resolve in its direction. Real charts rarely match a textbook drawing, which is why a heading on variations from the ideal pattern stands out. Chartists commonly look for volume to confirm a pattern's breakout. This page doesn't give pattern rules or price targets; for pattern statistics, see Bulkowski's encyclopedia. For a separate TradingLoot guide to reading chart patterns, see how to read any chart pattern.
Volume and open interest
In the book: headings on interpreting volume for all markets and open interest in futures, and a summary of volume and open-interest rules.
In plain English: volume is how many shares or contracts traded in a period. Open interest, used in futures and options, is the number of contracts still open: it rises when new positions are opened and falls when positions are closed. Read together with price, they help judge whether money is flowing into a move or out of it. In his essay, Murphy is blunt about it: "Volume precedes price." He adds that heavier volume should be running in the direction of the trend. For volume shown at each price level, see What Is Order Flow Trading?
Indicators
In the book: headings on moving averages, including envelopes, long-term use and whether to optimize them; on using oscillators in conjunction with the trend, rate of change and contrary opinion; on Welles Wilder's Parabolic and Directional Movement; and on advanced indicators such as Starc bands and Keltner channels. RSI, MACD and Bollinger Bands appear in the term index.
In plain English: a moving average is the average closing price over a set number of periods. It smooths out noise and follows the trend, but always lags behind price. Price crossing an average, or a fast average crossing a slow one, are common trend signals. Envelopes and bands are lines drawn around an average to frame normal price swings. Oscillators measure momentum: RSI runs from 0 to 100, and readings near the extremes are read as overbought or oversold, while MACD tracks the gap between two moving averages. A divergence is when price makes a new high or low and the oscillator doesn't, a possible sign the move is tiring. Tuning indicator settings to fit past data can simply fit noise; see Backtesting, Replay and Paper Trading Explained.
Alternative chart methods and theories
In the book: headings on point and figure charting, including box reversal and measuring techniques; basic and filtered candlestick patterns; Elliott Wave theory, the rule of alternation and Fibonacci time targets; and cycles, including combining cycle lengths and seasonal cycles.
In plain English: point and figure charts ignore time and plot only price moves of a chosen size, as columns of Xs for rises and Os for falls, starting a new column when price reverses by a set amount. Candlesticks show the same open, high, low and close as a bar chart, with the body shaded by direction. Elliott Wave theory holds that markets move in repeating wave patterns, and Fibonacci ratios are often used to estimate how far a pullback may go. Cycle analysis looks for roughly regular intervals between market lows, and some markets, especially commodities, show seasonal tendencies. These methods involve more interpretation than trendlines or moving averages, and practitioners often disagree about how to apply them. For a separate TradingLoot guide to reading candles, including patterns of one or several candles, see How to Read Japanese Candlesticks.
Beyond the chart
In the book: the publisher highlights intermarket relationships and stocks and stock rotation. The listing adds headings on the link between commodities and the dollar, stock sectors and industry groups, relative strength, stock market indicators and breadth, coordinating technical and fundamental analysis, the pros and cons of system trading, money management, trading tactics, intraday pivot points, Market Profile and continuous futures contracts.
In plain English: intermarket analysis compares related markets, such as bonds, commodities, currencies and stocks. Relative strength in this sense compares one stock or sector with the wider market, and is different from the RSI oscillator. Breadth indicators measure how many stocks are taking part in a move. The listing shows that money management and trading tactics are covered, but TradingLoot can't confirm what the book recommends there, so this page doesn't describe it.
How Murphy fits the tools together
The book's listing pairs oscillators with the trend in its headings, but the clearest account of how Murphy combines tools comes from outside the book, in his "Ten Laws" essay.
There, each tool has a job. The longer timeframe filters the shorter one: weekly signals filter daily ones, and daily signals filter intraday charts. Moving averages confirm that a trend has changed, while oscillators warn that a market has run too far and may turn. To decide which of those two to lean on, he uses the ADX indicator, which measures whether a market is trending: "A rising ADX line favors moving averages; a falling ADX favors oscillators." Volume then serves as confirmation.
TradingLoot's reading of that approach as a sequence. It's our summary, not the book's procedure:
- Establish the trend on a longer-term chart.
- Mark the support, resistance and trendlines that matter on that chart.
- Decide whether the market is trending or ranging, and pick trend-following or oscillator tools to match.
- Time entries and exits on a shorter-term chart, in the direction of the larger trend.
- Check whether volume supports the move.
Intermarket analysis in his own words
The publisher says this edition adds intermarket material. For how Murphy thinks about it, the best source is outside the book: a December 2003 interview with Matt Blackman, published in the May 2004 issue of Stocks & Commodities.
Murphy explained that he started as a stock analyst in the late 1960s and spent about 15 years in the futures business, where traders dealt in commodities, currencies, stocks and bonds side by side and could see how they moved together. Consulting for the Commodity Research Bureau, he noticed that bond yields and the CRB commodity index tracked each other closely. His reasoning: rising commodity prices are inflationary, inflation tends to push interest rates up, and rising rates are bad for stocks. In his words, "commodities are a leading indicator for bonds and stocks." He also noted that commodities tend to rise when the currency falls.
TradingLoot's caution: these are relationships, not fixed laws, and they can change. The magazine's own introduction notes that Murphy's 2004 intermarket book explained market changes since 1990. Murphy has since written further books on intermarket analysis.
Putting the ideas into practice
These are TradingLoot's suggestions for using a broad reference like this one. They aren't Murphy's instructions, and none of them guarantees results.
- Learn trend before indicators. Get comfortable with trend, support and resistance on plain charts first; most indicators are built on top of those ideas.
- Fix your timeframes. Write down which chart defines your trend and which one you use for timing, and keep them consistent.
- Use a small toolkit. One trend tool, one oscillator and volume is plenty to start. Know which one you rely on in a trending market and which in a range.
- Practise on history before risking money. Chart replay lets you apply what you've read bar by bar without hindsight; see practising on history with replay.
- Test a rule before trusting it. A pattern or indicator signal is a hypothesis until you've checked how it behaves on your market.
To choose charting software for this, see Futures Charting Software Compared or TradingView vs TrendSpider.
Possible misreadings
Ways a broad technical analysis reference can be misread, as TradingLoot sees it.
- "More indicators mean better signals."
- Many indicators are calculated from the same prices, so they often repeat each other. In his essay, Murphy chooses tools according to whether the market is trending, rather than stacking them.
- "A pattern tells you what will happen."
- Patterns describe tendencies, and they fail. Treat them as setups to test, not predictions.
- "It's a trading system."
- Its publisher presents it as an overview of the field. The listing even has a heading on the pros and cons of system trading, but the book surveys methods rather than handing you one.
- "It's only for futures traders."
- The emphasis is on futures, but the publisher says this edition covers all the financial markets, and the listing includes sections on stocks, sectors and market breadth.
- "A 1999 book is obsolete."
- The core concepts of trend, patterns, volume and indicators are still widely used. What has dated is the software, data and market examples, which predate today's platforms.
What the book doesn't give you
- A ready-made trading system to follow. It's a survey of methods.
- Guidance on today's charting platforms or order-flow tools, which came after this edition.
- Depth on any single method. For that, the specialist books on the technical analysis books page go further.
Who it's for
This is TradingLoot's guidance, based on how the publisher describes the book.
Likely to suit
- Newer traders who want one complete map of technical analysis before specializing.
- Self-taught chartists who want to fill gaps and learn the standard vocabulary.
- Futures traders in particular, given the book's emphasis.
May not need it
- Traders looking for one specific, ready-to-use method.
- Experienced technicians who already know the basics, except as a reference.
Key takeaways
- It's a broad survey of technical analysis with a futures emphasis, not a single method.
- Trend comes first: Murphy starts with long-term charts and trades in the direction of the trend.
- In his essay, each tool has a job: averages confirm trends, oscillators warn of turns, volume confirms.
- Whether a market is trending or ranging decides which tools to lean on.
- Intermarket links between commodities, bonds, stocks and the dollar are a signature Murphy theme.
- Use it as a reference, and test any rule before trading it.
How it fits with other technical analysis books
On TradingLoot's technical analysis books page, Murphy's book is the broad foundation, and four others each go deep on one approach: candlesticks, chart patterns, price action and Market Profile. A practical order, as TradingLoot sees it: the broad survey first, then the specialist book that matches how you trade.
Knowing the tools and executing them consistently are different problems. For the second, see Trading in the Zone.
Related book summaries

Japanese Candlestick Charting Techniques summary
Steve Nison
A full book on one tool Murphy covers among many: reading candlesticks in context and combining them with Western techniques.

Mind Over Markets summary
James F. Dalton, Eric T. Jones, and Robert B. Dalton
A different lens on the same markets: the market as an auction, read through price, time and value rather than patterns or indicators.
Book details
TradingLoot doesn't claim a first-hand reading of this book. The details below say what its description is based on.
How this page was sourced
Sources were checked in October 2026. The book's description comes from its publisher's page. Its topics come from the partial Google Books contents listing, which is used only to show what the book covers. Murphy's views come from his "Ten Laws" essay and his 2003 Stocks & Commodities interview, both outside the book; every quotation from them was checked word for word. The plain-English explanations are TradingLoot's own. Retailer listings, book-summary sites and unofficial copies of the book aren't used. See our Methodology for how we research and verify.
