
Encyclopedia of Chart Patterns by Thomas Bulkowski: Summary and Key Ideas
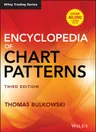
Encyclopedia of Chart Patterns is Thomas N. Bulkowski's reference on how chart patterns have actually performed. This summary explains what makes his approach different: measuring patterns rather than just naming them, judging them by what happens after the breakout, and treating failure as information. It isn't a pattern catalogue, and it doesn't reproduce the book's statistics.
Educational content only. This page describes a book; it is not investment advice, and no book described here predicts or guarantees trading results. Trading carries risk of loss. TradingLoot doesn't claim to have read this book; this guide is built from the sources described below and listed under Book details.
Where this guide comes from
- The publisher, Wiley, for what the book covers and what's new in this edition, along with its contents and index.
- The book's own Chapter 1, which Wiley publishes as a free sample. It's the source for Bulkowski's research method and his main conclusions. We describe those conclusions in words and don't reproduce his tables.
- Bulkowski outside the book: a 2006 interview about why he wrote the first edition, and his website, ThePatternSite. The website reflects his current research, not necessarily the 2021 edition, so we label anything taken from it.
- TradingLoot's own explanations and workflow, which say so where they appear.
Encyclopedia of Chart Patterns in one minute
- What it is: a 1,312-page reference covering 75 chart patterns. The current edition is the third, published by Wiley and dated April 2021.
- What makes it different: for each pattern, it pairs identification with performance statistics drawn from Bulkowski's own samples: how well the pattern worked, how often it failed, and which features went with better results.
- How it judges patterns: by what price did after the breakout, split by bull or bear market and by upward or downward breakout.
- The main caution: in Bulkowski's own words, the statistics give you an edge but won't on their own make you a successful trader.
- The short version, in TradingLoot's words: stop asking "what is this pattern called?" and start asking "how have patterns like this one actually behaved, and when did they fail?"
The question behind the book
Many chart-pattern guides teach you to recognize a shape and tell you what it's supposed to mean. Bulkowski started from a different place. In a 2006 interview he explained: "I started out wondering how often patterns worked and how often they failed." The sources he checked said patterns worked "most of the time," and he wanted to know what that actually meant. That question, he said, is how his first book, Encyclopedia of Chart Patterns, came about.
The third edition keeps that aim. Its opening chapter says the book will help you identify dozens of pattern types and show how they have performed over three decades, using statistics from hundreds or even thousands of samples per pattern.
What kind of book it is
It's a reference to look things up in, not a book to read cover to cover. After an introduction and a chapter on trading chart patterns, each pattern gets its own chapter, in alphabetical order, followed by a statistics summary, a glossary and a visual index. According to Wiley, each pattern chapter is built from the same parts: a tour of the pattern, identification guidelines, a focus on failures, statistics, trading tactics, a sample trade and, new in this edition, an "Experience" section drawn from Bulkowski's own trades.
Wiley describes the third edition as a substantial update:
- revised statistics on 75 patterns, 23 of them new to this edition;
- nearly four times as many samples as the second edition, and ten times as many as the first;
- new tables on how often stops are hit, how busted patterns perform, how performance has changed over the decades, and special pattern features.
The contents mark which patterns are new. Several are harmonic patterns whose names are trademarks of other authors, a reminder that the book covers patterns developed by others as well as his own.
How Bulkowski studies a pattern
The sample chapter shows his method through a pattern he calls the diving board, one of the patterns new to this edition. The process is more useful than the pattern itself:
- Notice. While paging through weekly charts, he spotted a shape that came before a strong move.
- Collect. He found the same shape in different stocks and different years, which he saw as a good sign because it meant different market conditions.
- Hunt for failures. He then went looking for examples that didn't work as expected, rather than only the ones that did.
- Catalogue and ask what matters. With examples of both, he asks what separates them: the pattern's length, how far price dropped, the stock's industry, the time of year, or whether it was a bull or bear market.
That sequence of observing, collecting, deliberately seeking failures, and only then drawing conclusions is the core of the book. TradingLoot doesn't reproduce the diving board's trading setup here; the point is the research habit.
Bull or bear market, up or down breakout
A breakout is the moment price leaves the pattern. On his website, Bulkowski defines it as price piercing one of the pattern's trendlines, or moving above its top or below its bottom. He judges a pattern by what happens after that moment, not by how it looks beforehand.
His results are split four ways: bull market with an upward breakout, bull market with a downward breakout, and the same two for bear markets. A pattern that does well in one of those four situations can do poorly in another, so a single "success rate" for a pattern hides most of the useful information. On his website, he defines bull and bear markets by fixed date ranges in the S&P 500, which shows how carefully the categories are drawn.
The sample chapter also defines reversal and continuation by behaviour rather than by name. A pattern acts as a reversal when price enters it from one direction and leaves in the other, and as a continuation when price enters and leaves in the same direction. In his framework the same pattern can be either, depending on what price actually does.
What tends to matter, and what doesn't
In the sample chapter, Bulkowski runs what he calls performance contests. For each feature, he checks across many pattern types whether patterns with that feature tended to do better or worse, in each of the four market and breakout combinations. These are findings from his samples, described here in words, not universal rules:
- Height
- Tall patterns, measured relative to the breakout price, tended to beat short ones in every combination he tested. He calls height a key indicator of future performance.
- The market's direction
- Breakouts in the same direction as the market, upward in bull markets and downward in bear markets, tended to perform better than breakouts against it.
- Throwbacks and pullbacks
- When price breaks out and then returns to the breakout level soon afterwards (a throwback after an upward breakout, a pullback after a downward one), performance tended to suffer. In his samples, these returns were common rather than rare.
- Width, breakout gaps and volume
- These showed only weak effects. Wide patterns, breakout-day gaps and heavy breakout volume sometimes went with slightly better results, but the margins were usually small. Of narrow margins like these, he writes: "The narrow lead is a warning that the indicator is weak as a predictor of future performance." On volume he goes further: "I think technical analysts put too much emphasis on volume."
That last point is worth dwelling on. Many traders treat rising volume as essential confirmation of a pattern. Bulkowski's samples suggest its predictive value is smaller than commonly believed.
Failure as data
Many pattern guides show only examples that worked. Bulkowski's chapters each include a section focused on failures, and Wiley says the book shows "how often a stop loss order will trigger at various locations within a chart pattern." That turns stop placement from guesswork into a question with historical evidence behind it.
He goes further with busted patterns. A pattern busts when price breaks out, moves only a little, then reverses and breaks out through the other side of the pattern. On his website he sets the threshold at a move of no more than 10% before the reversal. Wiley says the book shows how to trade busted patterns, and the sample chapter reports that single busted patterns often outperformed comparable patterns that didn't bust. A failed pattern isn't just a loss to forget; it can be the signal.
Representative patterns
The book covers 75 patterns. This page uses only three familiar families to show how Bulkowski's approach changes the way you look at them. The shape descriptions are TradingLoot's general explanations, not his identification guidelines, and no statistics are given.
Double tops and bottoms: one shape, several patterns
A double top is two peaks at roughly the same price with a dip between them; a double bottom is the mirror image. Most guides treat each as a single pattern. The book's contents split both into four variants, named Adam & Adam, Adam & Eve, Eve & Adam and Eve & Eve, and gives each its own chapter. The lesson: shapes that look alike may behave differently, and lumping them together can hide that.
Head-and-shoulders: the breakout line matters
A head-and-shoulders top has a higher peak between two lower ones; the bottom version is inverted. The book covers tops and bottoms, each with a separate chapter for complex versions with extra shoulders or heads. On his website, Bulkowski describes the neckline as the line joining the "armpits" of the pattern, with the signal coming when price crosses it. Until that happens, by his framework, you have a shape, not a confirmed pattern.
Triangles: watch the breakout, don't assume it
Ascending, descending and symmetrical triangles each get their own chapter. Their names describe their shape, but price can break out of any of them in either direction. In his 2006 interview, Bulkowski's preferred setup was a descending triangle that broke out upward, the opposite of what the shape alone might suggest. Measuring both breakout directions separately is what makes that kind of observation possible.
For fuller explanations of selected patterns, see TradingLoot's chart pattern guides.
Recognizing a pattern is not a strategy
Bulkowski is direct about the limits of his own statistics. Right after describing what the book offers, the sample chapter adds: "That information won't make you a successful trader, but it will give you an edge over other traders." What's missing, he says, is experience.
The same chapter shows how much sits around a pattern in his own approach: waiting for the pattern to confirm, using a stop-loss order, and checking that the overall market and the stock's industry are moving the right way. In his 2006 interview he described a checklist for each candidate trade covering his stop price, target price, expected market direction and a score for the pattern. The pattern starts the decision; it doesn't make it.
Reading pattern statistics wisely
These cautions are TradingLoot's, not Bulkowski's, though several follow from his own methods.
- An average isn't your trade.A pattern's average result blends big winners and outright failures. Any single trade can land anywhere in that range.
- Check what's being measured.On his website, Bulkowski measures moves to the "ultimate" high or low, the furthest price went before a significant reversal. That describes how far a move ran, not what a trader with a stop and an exit would actually have kept.
- Consider the market and era.The sample chapter's examples are U.S. stocks, and Wiley says the book tracks how performance has changed over the decades. Results from one market or period may not carry over to another, such as futures, forex or intraday charts.
- Small differences are weak evidence.Bulkowski flags narrow margins himself. Treat a one- or two-point edge as a hint, not a rule.
- Book and website aren't the same dataset.His website is updated as his research continues, so its figures and definitions may differ from the 2021 edition. Cite the one you're actually using.
Putting it into practice: TradingLoot's workflow
This is TradingLoot's own synthesis of the ideas above. It isn't Bulkowski's trading system, and it doesn't guarantee results.
- Identify a candidate pattern. Treat it as a candidate, not a signal, and note which variant it most resembles.
- Establish the context. Is the overall market rising or falling? Is the stock's industry with it? Would a breakout go with the market or against it?
- Wait for the actual breakout. Let price choose the direction rather than assuming it from the pattern's name.
- Define invalidation before entering. Decide where the trade is wrong, place the stop there, and size the position so that being wrong is affordable. Remember that price often returns to the breakout level.
- Treat historical averages as background, not certainty. Use them to compare setups, not to predict this one.
- Test and replay. Check how the pattern behaves on your own market and timeframe before trading it; see backtesting and replay.
- Journal the results. Record the pattern, context, breakout, stop and outcome, including failures and busts. Over time, that becomes your own small version of his research. See Trading Journal Software Compared.
Possible misreadings
Ways Bulkowski-style statistics are commonly misread, as TradingLoot sees it.
- "A pattern's statistic is my probability of winning."
- It's an average from past samples under particular conditions, not a forecast for your trade.
- "Heavy volume confirms the pattern."
- In his samples, volume effects were relatively weak. It's one input, not a requirement.
- "The best-ranked pattern is always the one to trade."
- Context changes results. The same pattern can behave differently in bull and bear markets and in each breakout direction.
- "The website and the book say the same thing."
- His website reflects ongoing research and can differ from the 2021 edition.
- "The encyclopedia is a trading system."
- It includes trading tactics for each pattern, but by his own account statistics provide an edge, not success; the rest of the plan is still yours.
What the book doesn't give you
- A short introduction. At 1,312 pages, it's built for looking things up.
- Certainty. Its statistics describe past samples, not what your next trade will do.
- A complete plan. Patterns, statistics and tactics still need your own risk rules, position sizing and execution.
Who it's for
This is TradingLoot's guidance, based on how Wiley describes the book and the sample chapter.
Likely to suit
- Traders who already trade chart patterns and want evidence about how they have behaved.
- Stock traders in particular, since the sample chapter's examples are stocks.
- Anyone who wants to think about failures, stops and context, not just pattern shapes.
May not need it
- Complete beginners who want a short overview of chart reading first.
- Traders who don't use chart patterns at all.
Key takeaways
- Bulkowski set out to measure how often patterns work and fail, not just to describe them.
- Patterns are judged after the breakout, separately for bull and bear markets and each direction.
- In his samples, tall patterns and breakouts with the market trend tended to do better.
- Width, breakout gaps and volume showed only weak effects; returns to the breakout level tended to hurt.
- Failures and busted patterns are information, and can be opportunities.
- Statistics give an edge, not certainty; experience and risk control complete the picture.
How it differs from Murphy and Nison
Each book does a different job. TradingLoot doesn't rank them. Murphy's Technical Analysis of the Financial Markets is a broad framework for technical analysis as a whole. Nison's Japanese Candlestick Charting Techniques teaches the language of candles and the importance of context. Bulkowski's encyclopedia is an empirical study of how chart patterns have turned out, including how they failed.
The idea that any single outcome is uncertain, and that results only make sense over many trades, also runs through Trading in the Zone, from the psychology side.
Related book summaries

Japanese Candlestick Charting Techniques summary
Steve Nison
Candlestick signals read in context, a bar-level complement to whole chart patterns.

Trading in the Zone summary
Mark Douglas
A way of thinking for patterns that sometimes fail: an edge as a probability, judged over a series of trades.
Related TradingLoot resources
- Technical analysis books: the five books grouped by what each teaches.
- Backtesting, Replay and Paper Trading Explained: ways to test patterns on your own market.
- All book guides.
Book details
TradingLoot doesn't claim a first-hand reading of this book. The details below say what its description is based on.
How this page was sourced
Sources were checked in October 2026. The book's description, contents and index come from Wiley. Bulkowski's method and conclusions come from the book's Chapter 1, published by Wiley as a sample; its statistical tables are not reproduced. His reasons for writing the book come from his 2006 Stocks & Commodities interview, and a few definitions come from his website's glossary, labelled as his current website terminology. Every quotation was checked word for word. The plain-English explanations and the workflow are TradingLoot's own. Retailer listings, book-summary sites and unofficial copies of the book aren't used. See our Methodology for how we research and verify.
